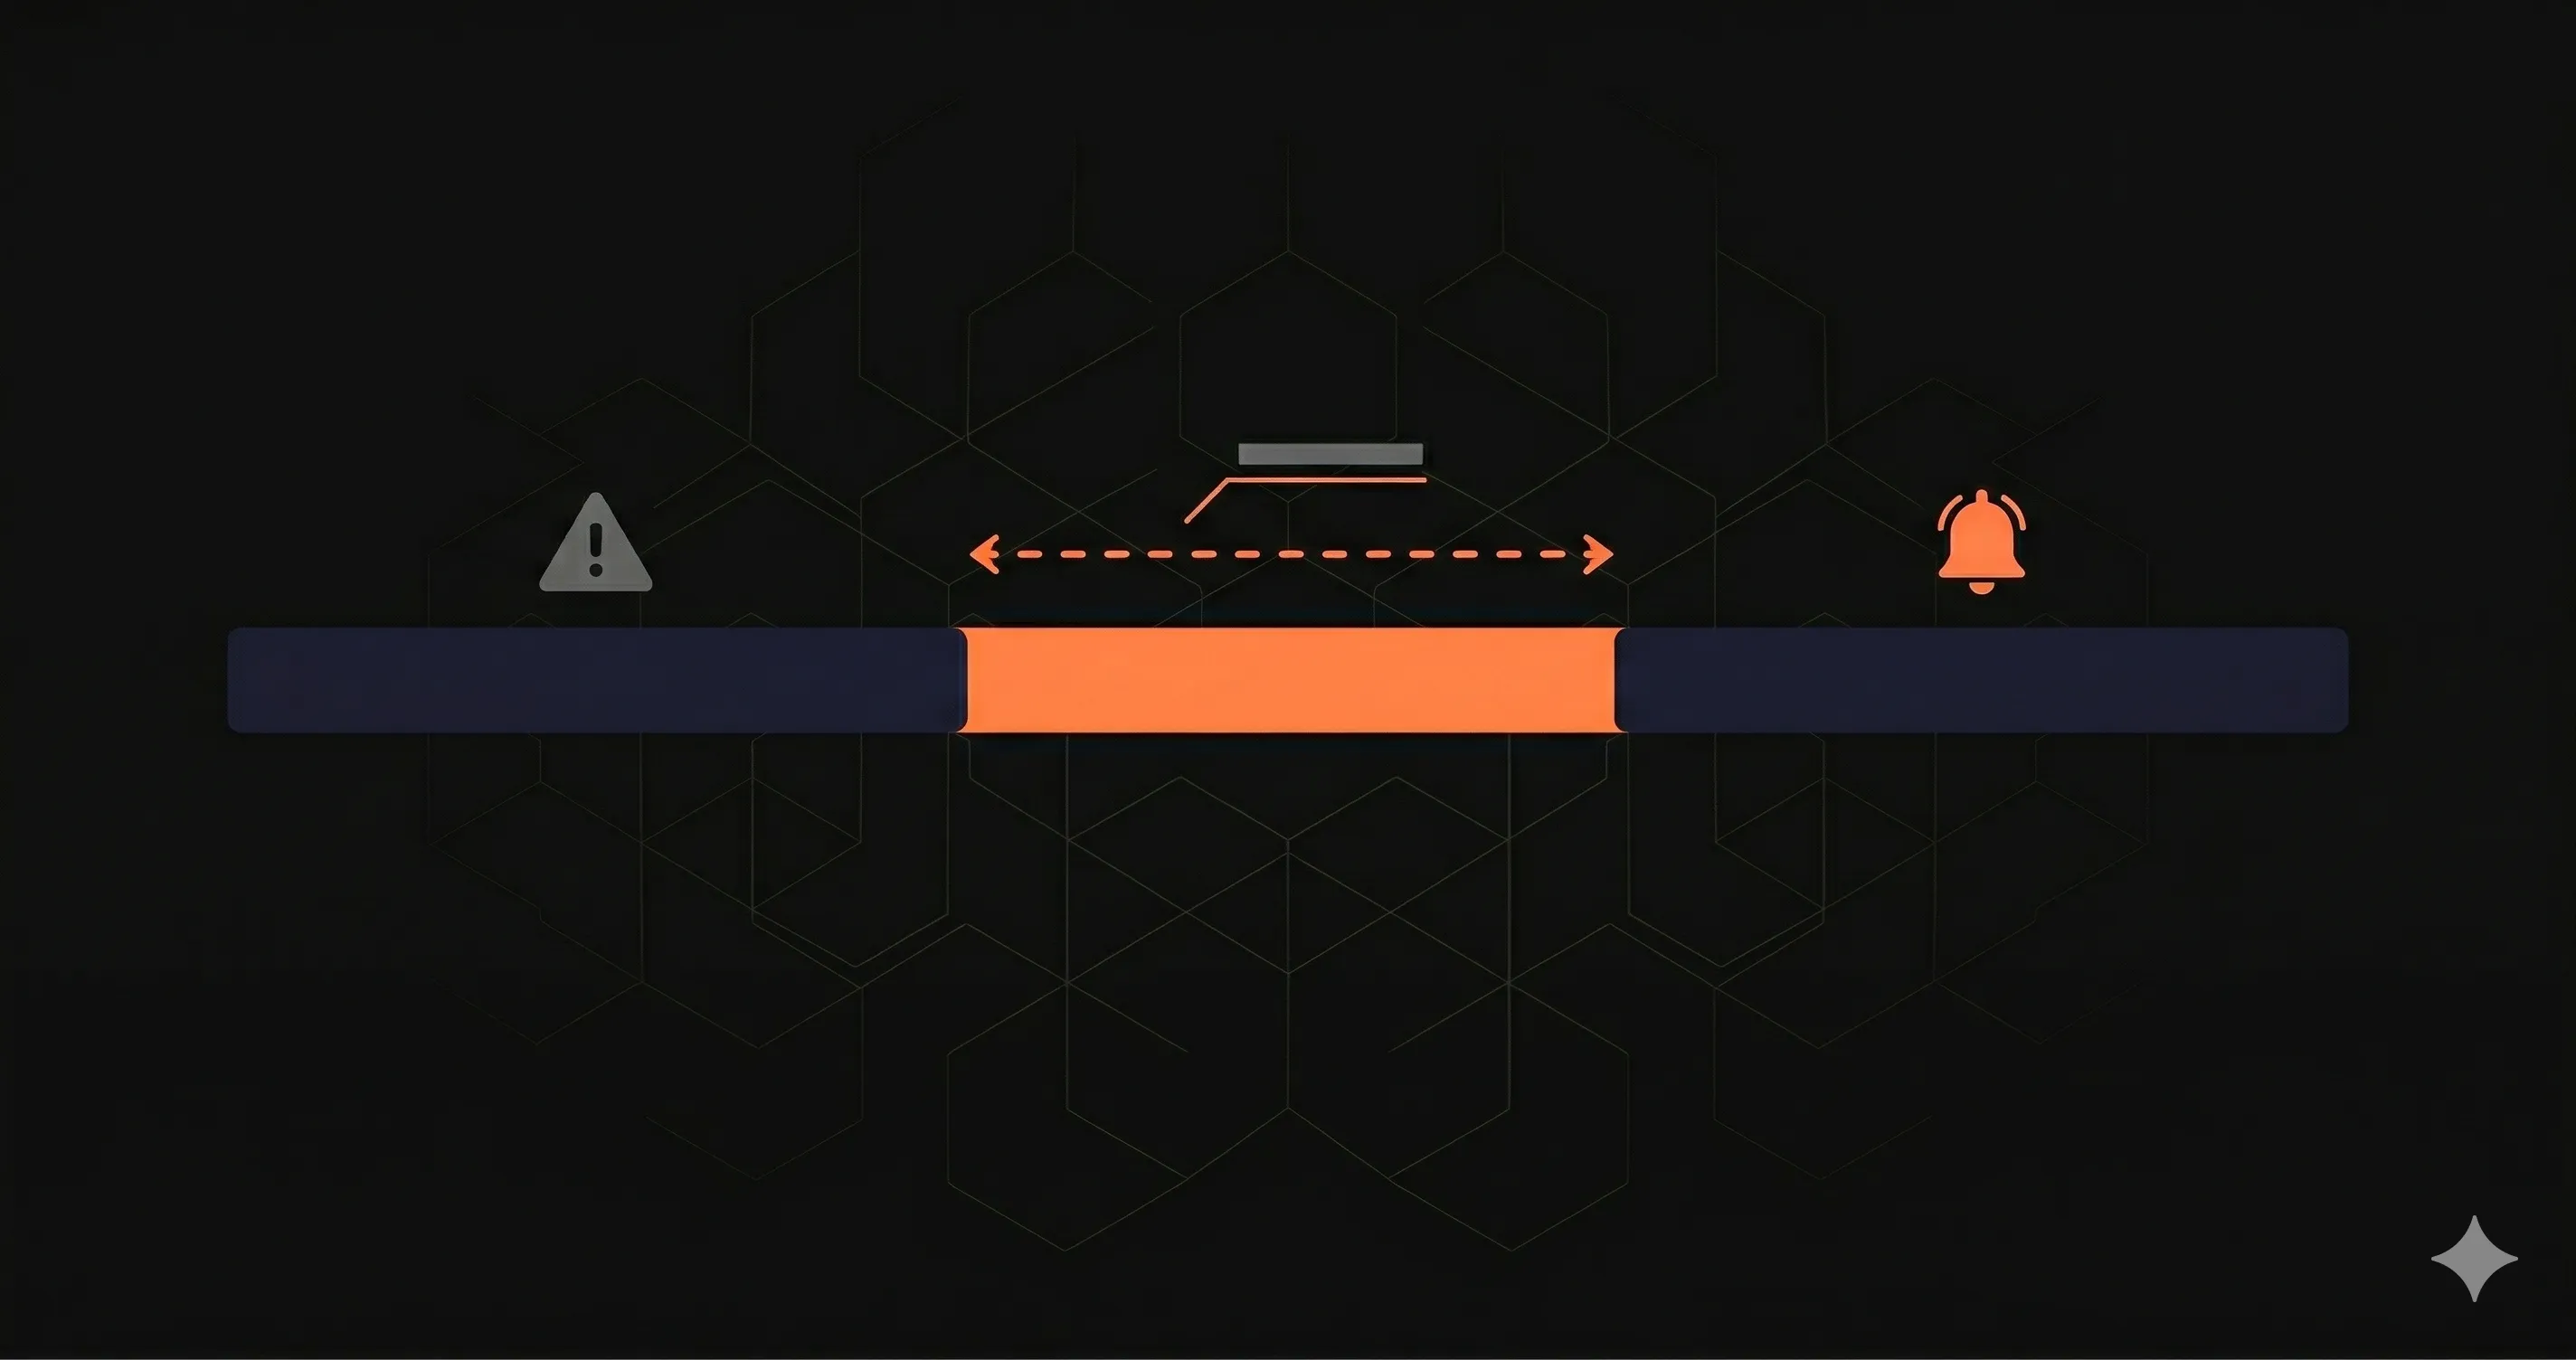
Your /api/checkout started returning 500 errors at 2:13 AM. Your external monitor pinged the health check at 2:15 AM, it returned 200 (the health check doesn't test checkout). Your on-call engineer got paged at 3:00 AM when a customer tweeted about failed payments.
MTTD for that incident: 47 minutes. Nearly an hour of lost revenue before anyone knew.
Mean Time to Detect (MTTD) is the most underrated metric in incident management. Everyone focuses on MTTR (time to fix). But you can't fix what you don't know is broken.
What is MTTD?
MTTD = time when incident is detected − time when incident began
It measures the gap between "something broke" and "someone knows." This gap is pure waste, every second of undetected downtime is a second of user impact with zero response activity.
    Incident timeline:
─────────────────────────────────────────────────
2:13 AM  │ API starts returning 500s
         │
         │  ← MTTD: 47 minutes (nobody knows yet)
         │
3:00 AM  │ Customer tweets, engineer paged
         │
         │  ← MTTR: 23 minutes (fixing the issue)
         │
3:23 AM  │ Fix deployed, API recovered
─────────────────────────────────────────────────
Total incident: 70 minutes
Detection took: 67% of total time
In this example, detection was 67% of the total incident duration. Cutting MTTD from 47 minutes to 1 minute would have reduced total impact from 70 minutes to 24 minutes, without changing how fast the team fixes things.
MTTD vs MTTR vs MTTA vs MTBF
| Metric | Measures | You control it by |
|---|---|---|
| MTTD (Detect) | Time to discover the incident | Better monitoring, faster alerts |
| MTTA (Acknowledge) | Time from alert to human response | On-call processes, alert routing |
| MTTR (Recovery) | Time to fix and restore service | Runbooks, rollback automation |
| MTBF (Between Failures) | Time between incidents | Code quality, testing, reliability |
Total incident impact = MTTD + MTTA + MTTR
MTTD is the easiest to reduce because it's purely a monitoring problem, no human decision-making required.
MTTD Benchmarks by Monitoring Approach
| Approach | Typical MTTD | Why |
|---|---|---|
| Customer reports (Twitter, email) | 30-120 minutes | You wait for users to tell you |
| External pings (UptimeRobot, Pingdom) | 1-5 minutes | Check intervals + alert delay |
| APM tools (Datadog, New Relic) | 1-3 minutes | Sampling + evaluation windows |
| In-process instrumentation (OpenTelemetry, custom metrics) | Seconds to 1 minute | Real traffic measured, alert as soon as a threshold is crossed |
| Elite SRE teams target | < 60 seconds | Multi-layer monitoring + automation |
Why MTTD Is High (and How to Fix It)
1. Health checks don't test what breaks
Your /api/health returns 200 while /api/checkout returns 500. The health check tests database connectivity, it doesn't test business logic. Fix: monitor every endpoint, not just the health check.
2. Check intervals are too long
A 5-minute check interval means up to 5 minutes of undetected downtime. A 1-minute interval is better but still misses sub-minute outages. Fix: use real-traffic monitoring instead of interval-based pings.
3. Alert evaluation windows add delay
Most tools require "condition met for X minutes" before alerting (to avoid false positives). A 2-minute evaluation window on a 1-minute check interval means 3+ minutes minimum MTTD. Fix: use instant alerting with deduplication instead of evaluation windows.
4. Alerts go to the wrong channel
An email alert at 3 AM has a read time of 5+ hours. A Slack notification during a busy day gets buried. Fix: use WhatsApp or phone calls for critical alerts, channels that bypass DND.
5. Partial failures are invisible
3% of requests to /api/payments fail due to a race condition. External monitoring never catches it because the synthetic ping always succeeds. Fix: monitor error rates from real traffic, not synthetic checks.
How to Get MTTD Under a Minute
Combining the fixes above is what moves MTTD from minutes to seconds:
- Measure real traffic: instrument your API routes in-process (OpenTelemetry or your APM's agent) so a failing request is visible without waiting for the next synthetic check.
- Short alert windows: alert on the error rate over the last 30 to 60 seconds, with deduplication, instead of multi-minute evaluation windows.
- Per-endpoint alerts:
/api/checkoutbreaking should page you on its own, regardless of what/api/healthsays. - Keep external checks too: a 1-minute uptime check from outside catches DNS, TLS and full outages where no traffic reaches your code at all.
- Route critical alerts to a channel that wakes someone up: a pager, phone call or push notification for the on-call engineer, not a shared email inbox.