Next.js makes it easy to ship API routes to production. It is significantly harder to know if those routes are healthy once real users start hitting them. This guide covers everything you need to monitor Next.js API routes in production, vendor-neutral, focused on what actually catches incidents instead of what looks good in a marketing demo.
By the end of this post you'll know exactly which monitoring layers you need, which tools fit each layer, and how to set up a complete stack in about 30 minutes.
Why Next.js API Monitoring Is Different
Next.js applications combine multiple workloads in a single deployment. A single Next.js project typically runs:
- API routes in
/app/api/or/pages/api/ - Server actions for form submissions and mutations
- Server components that fetch data during SSR
- Middleware for auth, redirects, and edge logic
Most of this runs on serverless infrastructure, Vercel Functions, AWS Lambda, Netlify Functions, Cloudflare Workers. That breaks the assumptions traditional monitoring tools make:
- You can't install an agent on the host because there is no host you control.
- Functions are short-lived, so log shipping needs to happen synchronously or be flushed before exit.
- Cold starts add real latency that needs to be tracked separately from warm execution.
- Bills scale with invocations, so monitoring overhead has a real dollar cost.
Next.js shipped a hook called instrumentation.ts specifically to solve this. It runs once per server boot, lets monitoring SDKs attach themselves to the runtime, and gives them access to the request lifecycle without an agent. Modern Next.js monitoring is built around this hook.
The 3 Layers of Next.js API Monitoring
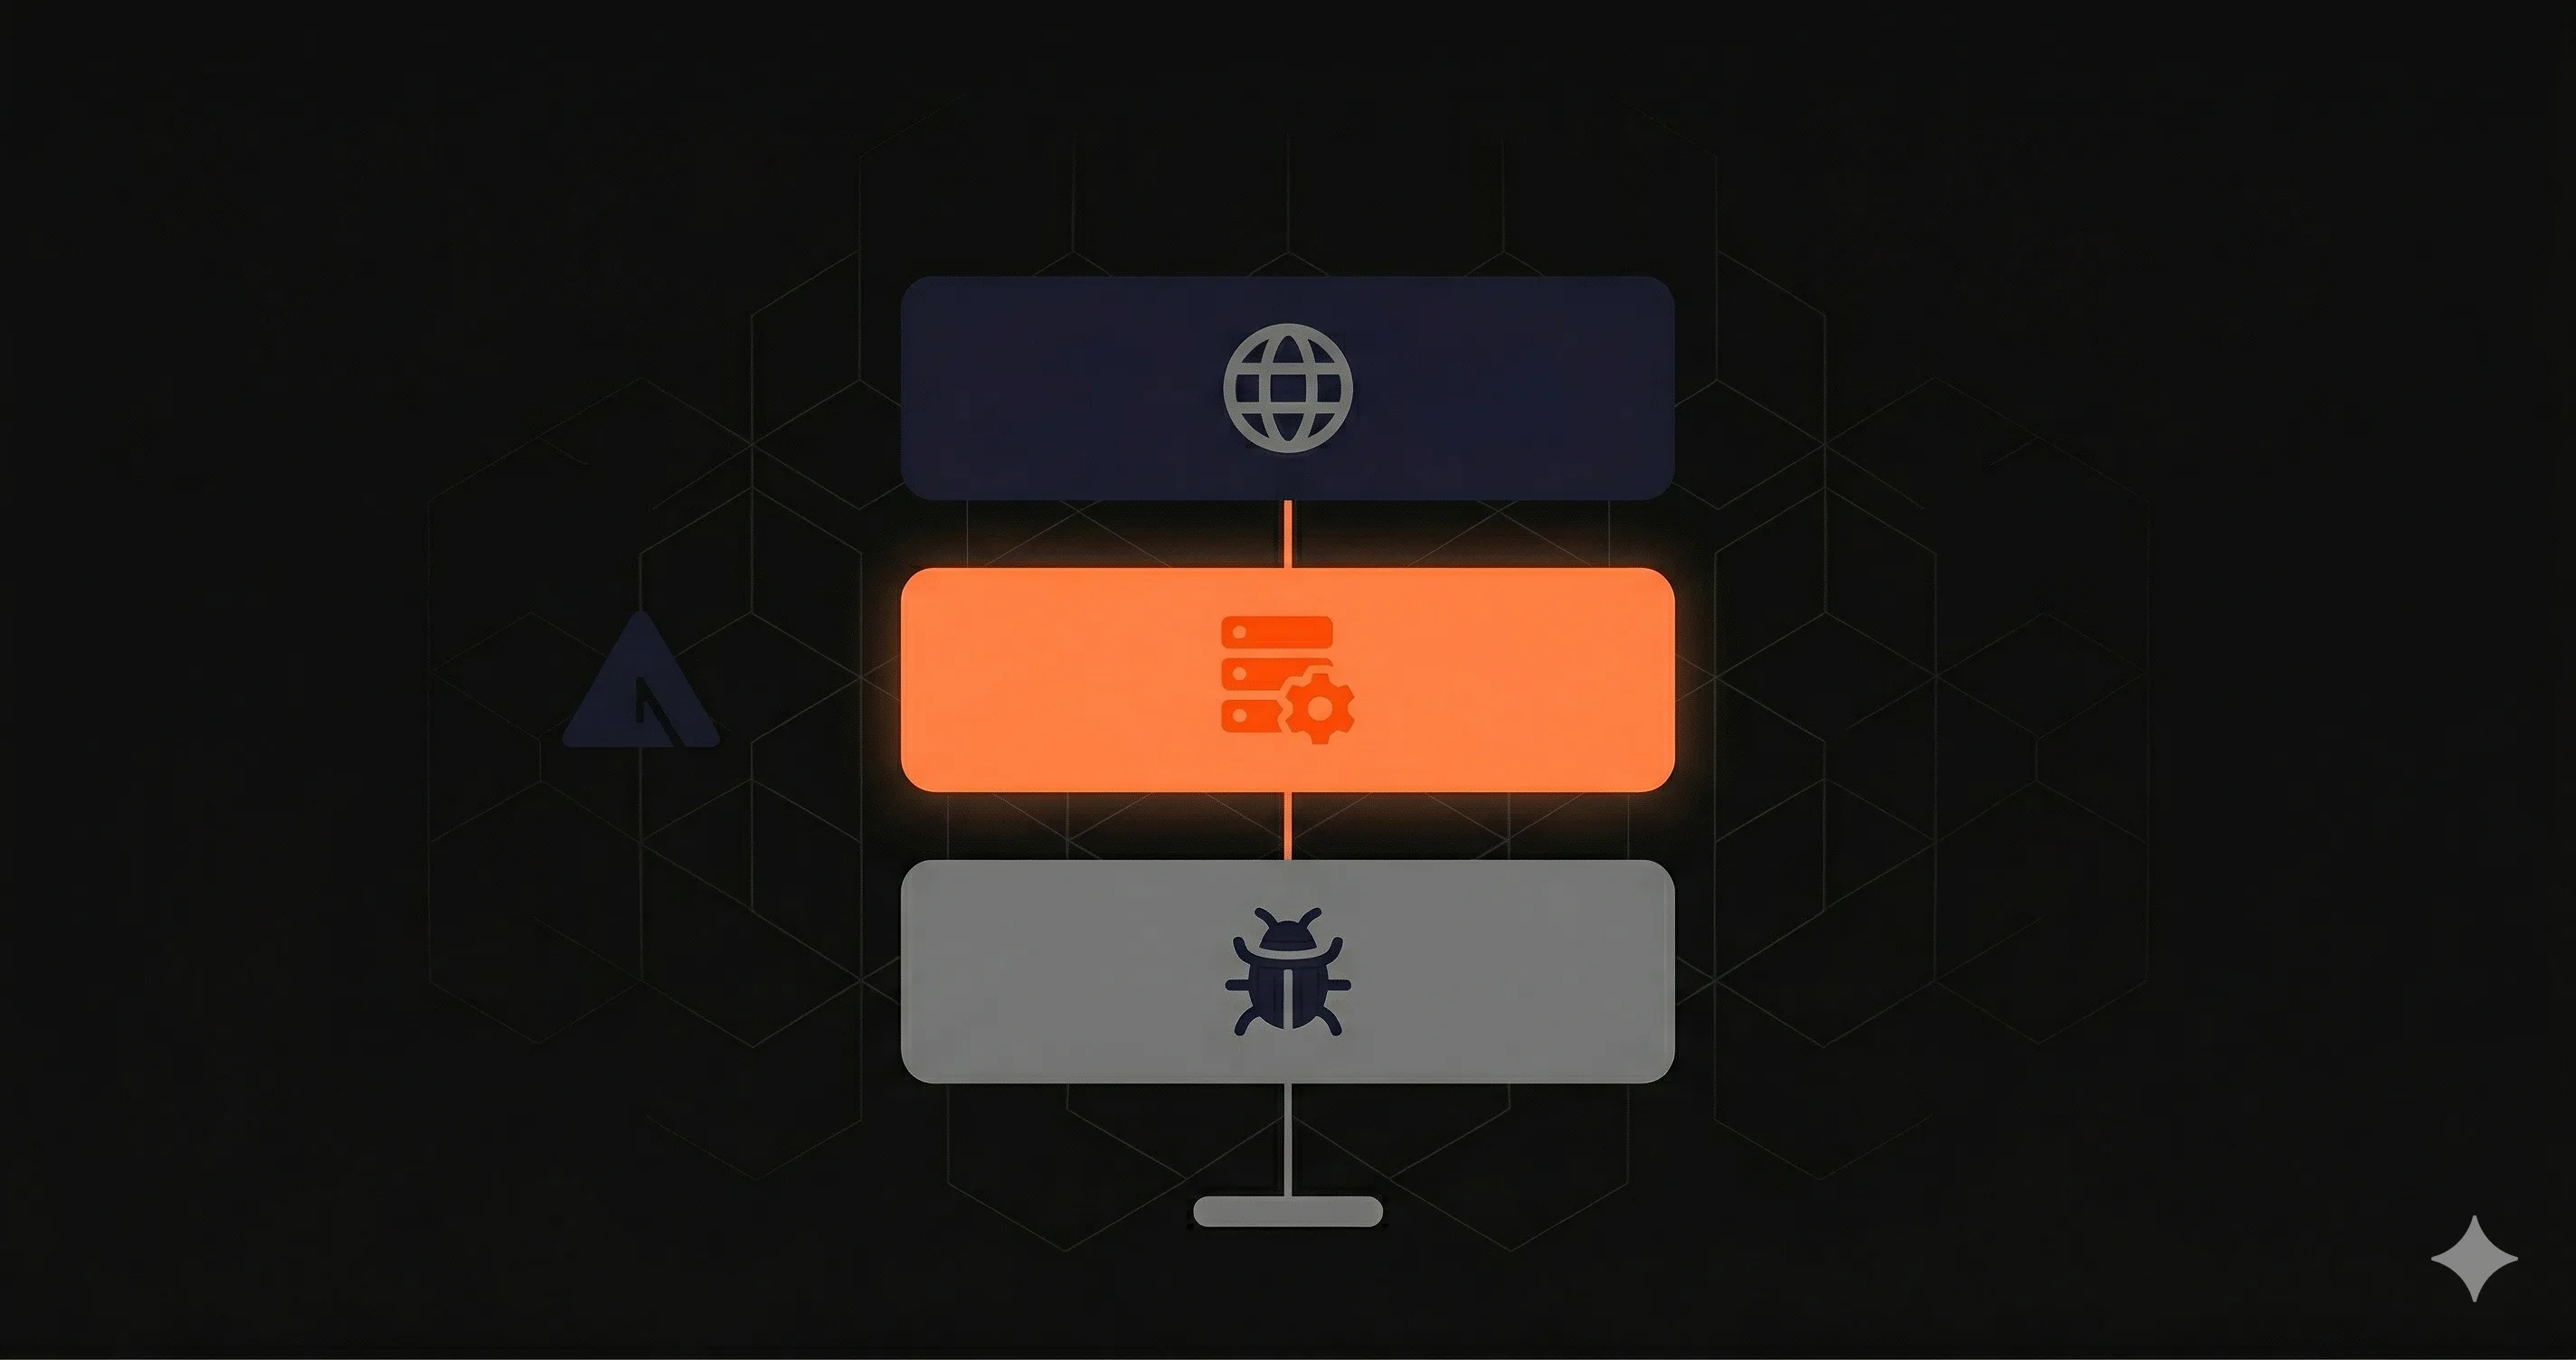
Production-grade monitoring is not a single tool, it is three layers that catch different failure modes. Skipping any layer leaves a blind spot.
Layer 1: External Uptime Checks
This layer answers "is my API reachable from the public internet?" A monitoring service in another data center sends an HTTP request to your endpoint on a schedule and reports back.
External pings catch the failure modes that have nothing to do with your code:
- DNS misconfigurations
- SSL/TLS certificate expiration
- CDN outages
- Vercel/AWS regional outages
- Networking issues between users and your servers
- Deploy that bricks the function entirely
None of these get caught by code instrumentation because your code never runs. The only way to detect them is from outside your infrastructure.
Tool options: UptimeRobot (free, basic), Pingdom (mature), Better Stack (modern UX).
Layer 2: Internal Execution Monitoring
This layer answers "what is happening inside my server when it handles a real request?" A monitoring SDK runs inside your Next.js process and captures latency, error rates, and execution metrics for every request, not just synthetic pings.
Internal monitoring catches the failure modes that are invisible from outside:
- Slow database queries that don't trigger an exception
- Latency degradation on a specific route after a deploy
- P95 spikes that average out to "fine" but ruin the worst 5% of requests
- Cold start delays on serverless platforms
- Middleware that's adding 200ms to every request
External pings can never see any of this. The endpoint returns 200, the user is just unhappy.
Tool options: Datadog APM (enterprise), New Relic (enterprise), Sentry Performance (sample-based), OpenTelemetry via instrumentation.ts (vendor-neutral, no agents).
Layer 3: Error Tracking
This layer answers "what exceptions is my code throwing, and what's the stack trace?" When an exception is thrown (caught or uncaught) an error tracking SDK captures it, groups identical errors, and notifies you.
Error tracking catches the failures that are happening at the code level:
- Unhandled exceptions in API route handlers
- TypeError, ReferenceError, undefined property access
- Failed assertions in business logic
- Errors from third-party SDK calls
- Frontend JavaScript errors when configured for the client side
Tool options: Sentry (best in class), Bugsnag, Rollbar, Highlight.
Why You Need All Three
Each layer catches failures the others miss. Here's a real example:
Imagine your /api/checkout route. Three failure modes:
- Stripe API call throws after the rate limit kicks in. Sentry catches the exception and you know within seconds. Layer 3 wins.
- Database query hits a missing index and starts taking 5 seconds. No exception is thrown. The endpoint returns 200, just slowly. Sentry sees nothing. Internal monitoring catches the P95 spike and alerts. Layer 2 wins.
- Vercel deploys the wrong commit and the function throws on import. Your code doesn't run, so nothing reports. External pings detect the 500 from outside in under 60 seconds. Layer 1 wins.
Drop any layer and you'll find out about that failure mode from a support ticket, hours after it started.
The 30-Minute Setup
Here's the fastest path to a complete Next.js monitoring stack. Total time: 30 minutes.
Step 1: Install Sentry for Errors (10 minutes)
npm install --save @sentry/nextjs
npx @sentry/wizard@latest -i nextjs
The Sentry wizard adds the necessary files and environment variables. Deploy and verify a test error reaches your Sentry dashboard.
Step 2: Add Uptime Checks + Latency (5 minutes)
For layer 1, add a lightweight health route (for example /api/health) and point an external checker such as UptimeRobot or Better Stack at it, plus your most important API routes.
For layer 2, turn on Sentry's tracing in instrumentation.ts so you get server-side latency per route:
// instrumentation.ts
import * as Sentry from '@sentry/nextjs'

export function register() {
  Sentry.init({
    dsn: process.env.SENTRY_DSN,
    tracesSampleRate: 0.1, // sample 10% of requests for latency data
  })
}
Deploy and confirm that transactions for your API routes show up in Sentry.
Step 3: Configure Alert Channels (10 minutes)
Set up alert routing in both tools. The minimum:
- Sentry: Slack integration for new errors and error spikes.
- Uptime checker: Slack for normal alerts, SMS or phone for critical (sustained downtime).
Step 4: Verify with a Test Failure (5 minutes)
Trigger a controlled failure on a test route, throw an error, add a sleep, or temporarily break a database call. Confirm you receive alerts from the relevant tool. If you don't, fix the configuration before you're in production.
Cost Breakdown
| Layer | Tool | Free Tier | Paid Tier |
|---|---|---|---|
| External uptime | UptimeRobot | 50 monitors (5-min) | $7/mo Pro (1-min) |
| Internal execution | Sentry Performance (same) | included | included |
| Error tracking | Sentry | 5K errors/mo | $26/mo Team |
| Total | $0/mo | $33/mo |
For a small Next.js team, roughly $33/month gets you all three monitoring layers. Compare that with Datadog's $400-1,200/month for a similar setup.
Common Mistakes
- Only installing one layer. Sentry alone misses uptime. UptimeRobot alone misses real latency. Internal monitoring alone misses platform outages.
- Alerting on every error. Configure error rate thresholds, not single events. Otherwise you'll get alert fatigue and start ignoring real incidents.
- Forgetting to test alert routing. Run a controlled failure after every monitoring config change. The first time you find out alerts are broken should not be during a real incident.
- Monitoring only production. Add monitoring to staging too, with a separate alert channel. You'll catch issues before they reach prod.